One dashboard engine. A different view for every level of your business.
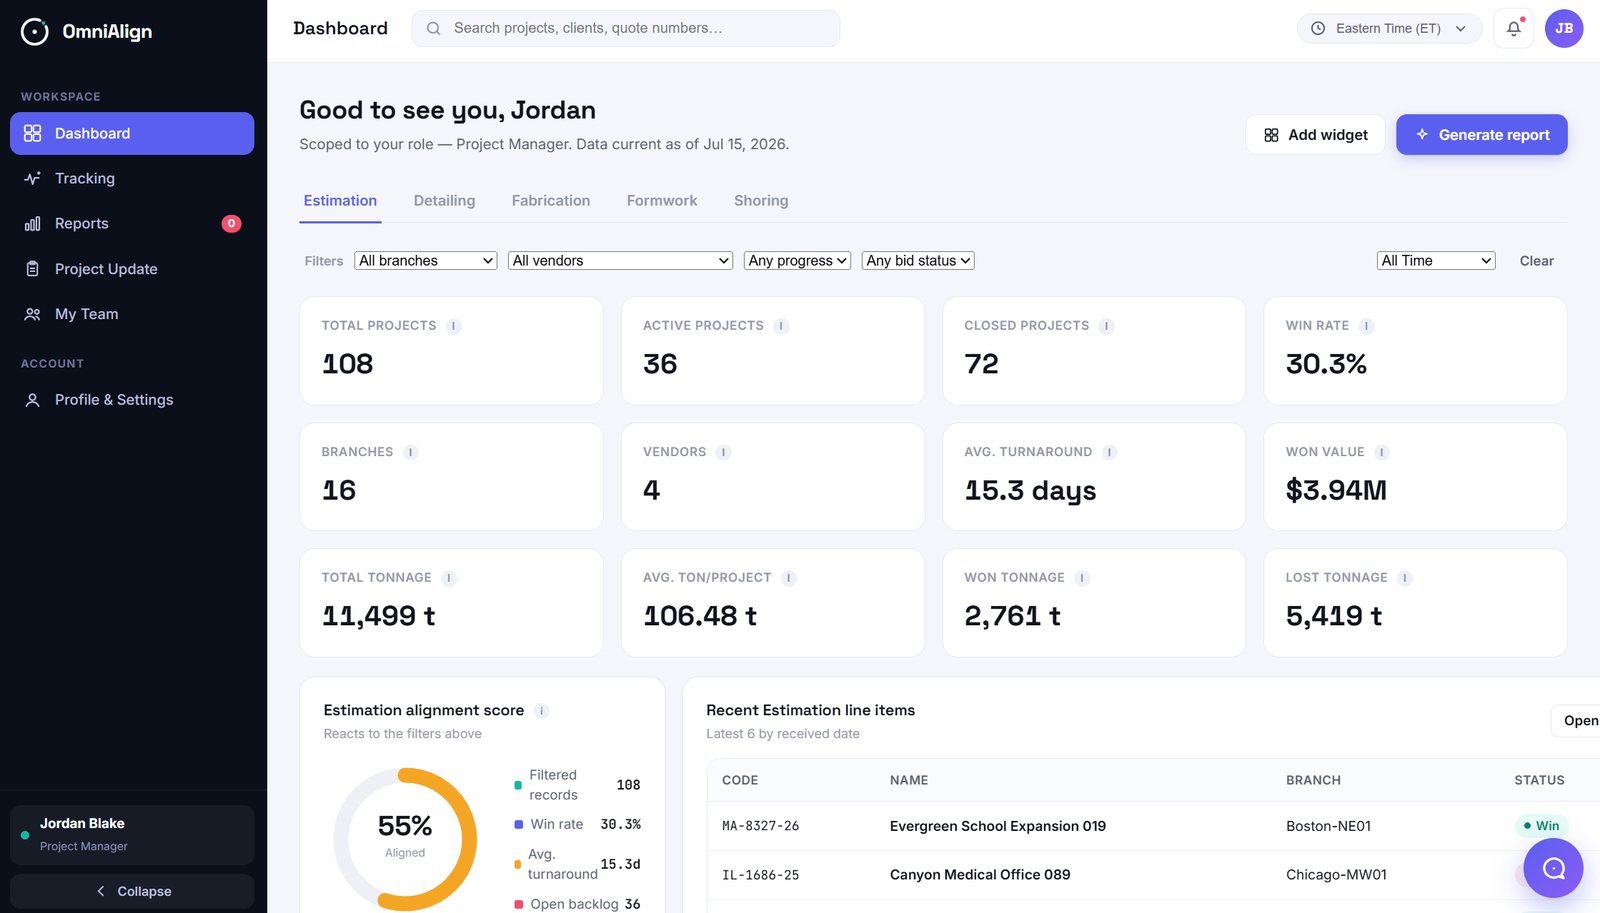
The same underlying data powers a portfolio view for leadership, a workload view for project managers, and a status view for customers and account managers — each one built from widgets your team can rearrange, add to, or retire as priorities change.
The right view for the person looking at it
A dashboard only earns its place on someone's screen if it answers the question they actually have — OmniAlign scopes each one to the role viewing it.
Leadership & Admins
Portfolio-wide health — win rate, on-time performance, and active pipeline value across every branch, in one view.
Project Managers & Consultants
Their own workload — open items, turnaround time, and backlog by stage — without noise from projects they don't own.
Operations Teams
Utilization, on-time shipping, and system-specific performance for the equipment and crews they manage.
Customers & Account Managers
Status and milestone visibility for their own projects, with reports available to download on demand.
Add a widget. Move a widget. Retire a widget.
Every dashboard is a canvas, not a fixed template. Teams add the KPI tiles, charts, and tables that matter to them, filter by branch, vendor, or time period, and generate a custom report straight from the same screen.
- Add or remove widgets without waiting on a development cycle
- Filter any dashboard by branch, vendor, progress, or bid status
- Generate a report directly from the dashboard you're already looking at
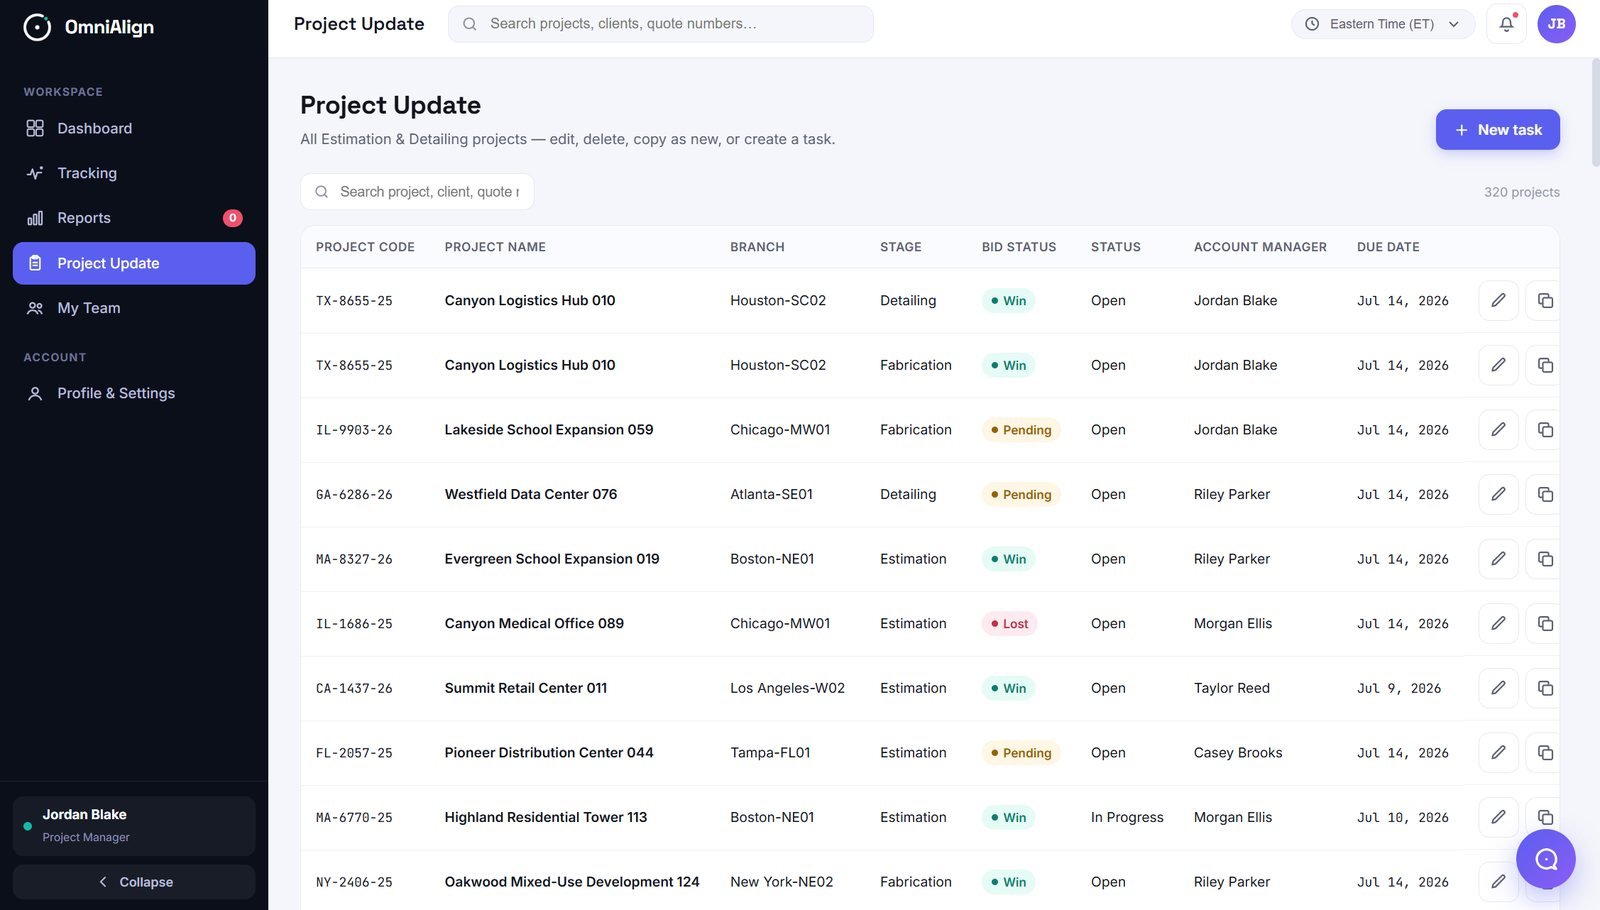
Every tile leads somewhere
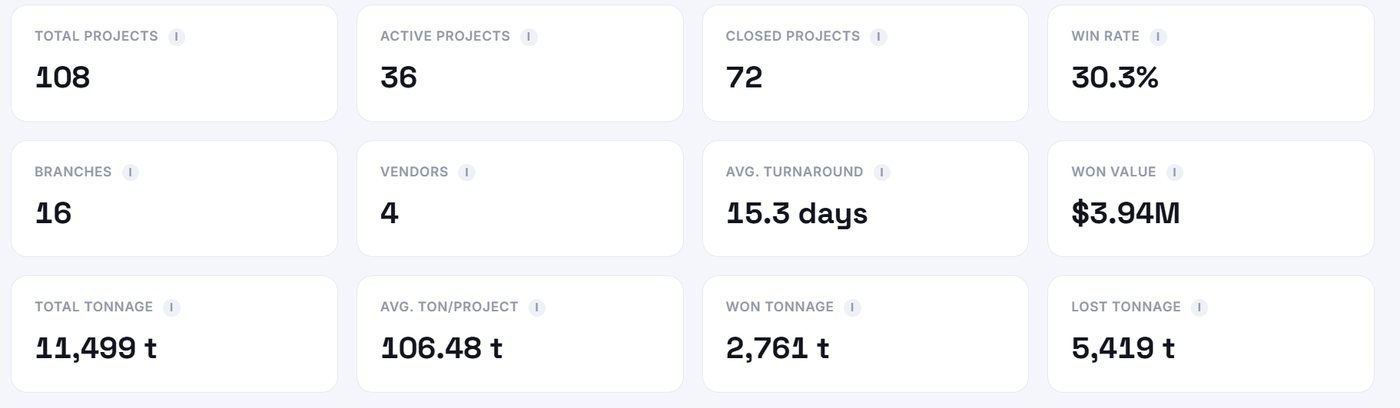
A KPI tile isn't a dead end — drill into any number to see the underlying projects, edit a record, or create a follow-up task, without leaving the dashboard's context.
When the widget you need doesn't exist yet, just ask
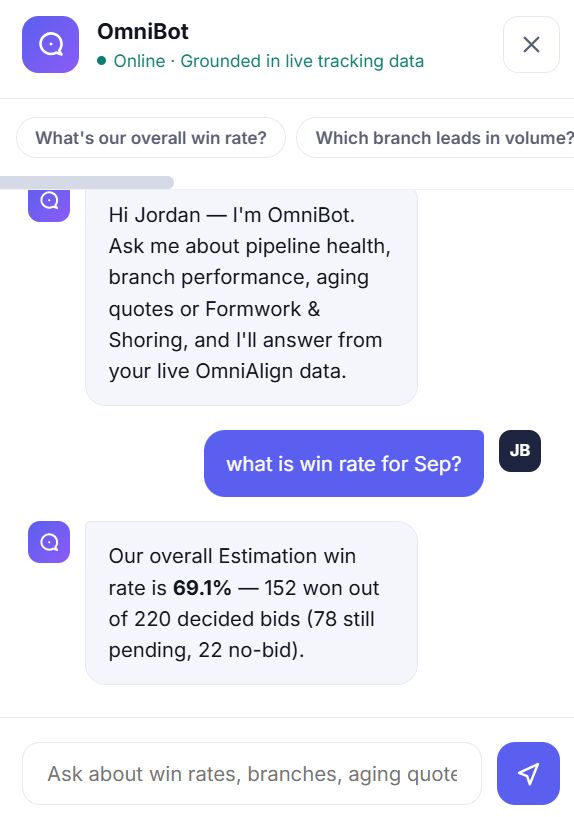
Instead of building a new widget for a one-off question, a user can simply ask OmniBot — e.g. “what is win rate for Sep?” — and get an answer grounded in the same live tracking data behind every dashboard.
Learn about OmniBot